Benchmarks#
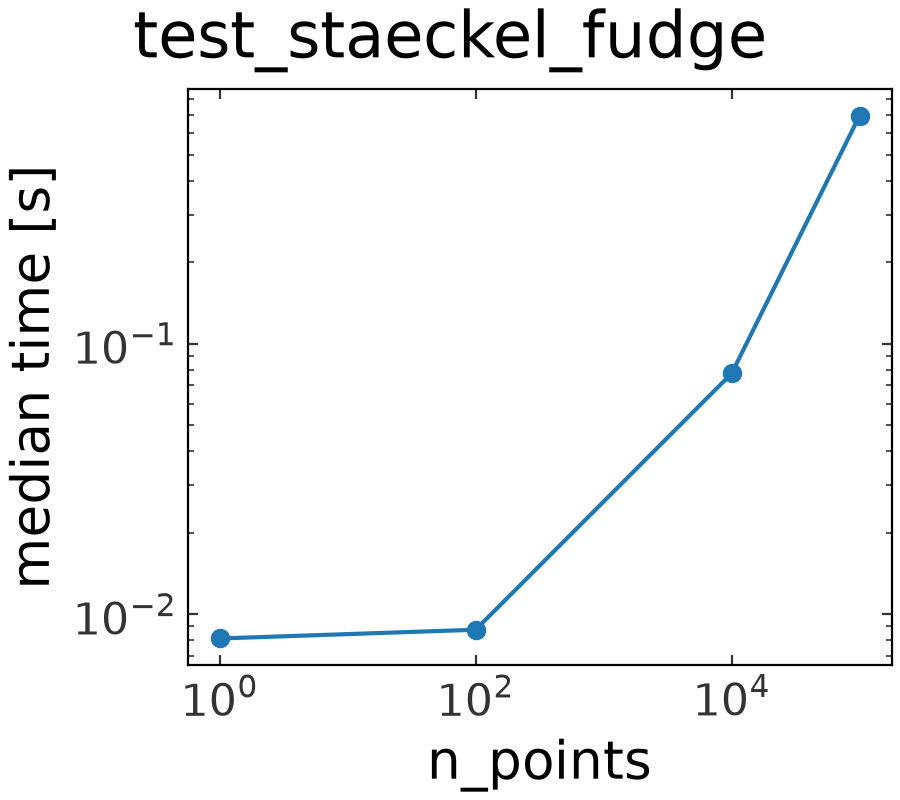
These plots show how the cost of some of Gala’s more expensive operations scales with
the size of the input. They are produced by the benchmarks in tests/benchmarks,
which run on GitHub Actions (ubuntu-latest) for every commit to main and every
release. The times are wall-clock times on shared virtual machines, so expect noise at
the ~10-20% level: use these plots for scaling behavior, not precise absolute
timings. For release builds of these docs, the plots show results for that release;
otherwise they show the latest commit to main.
Performance regressions are tracked separately with CodSpeed.
Action-angle coordinates#
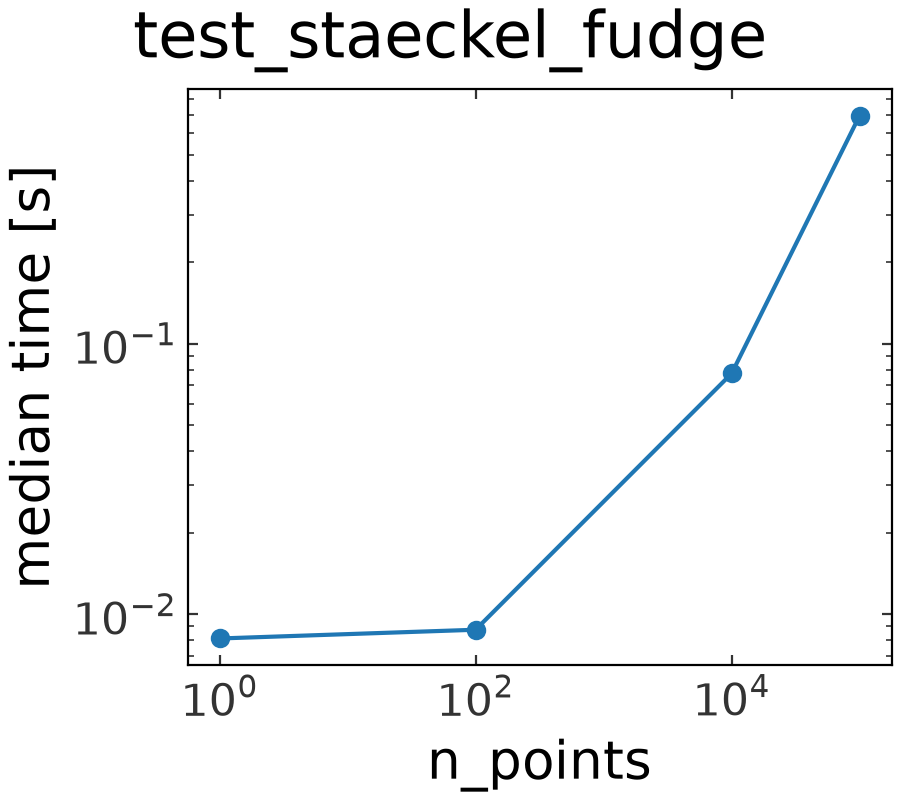
test_staeckel_fudge times find_actions_staeckel_fudge()
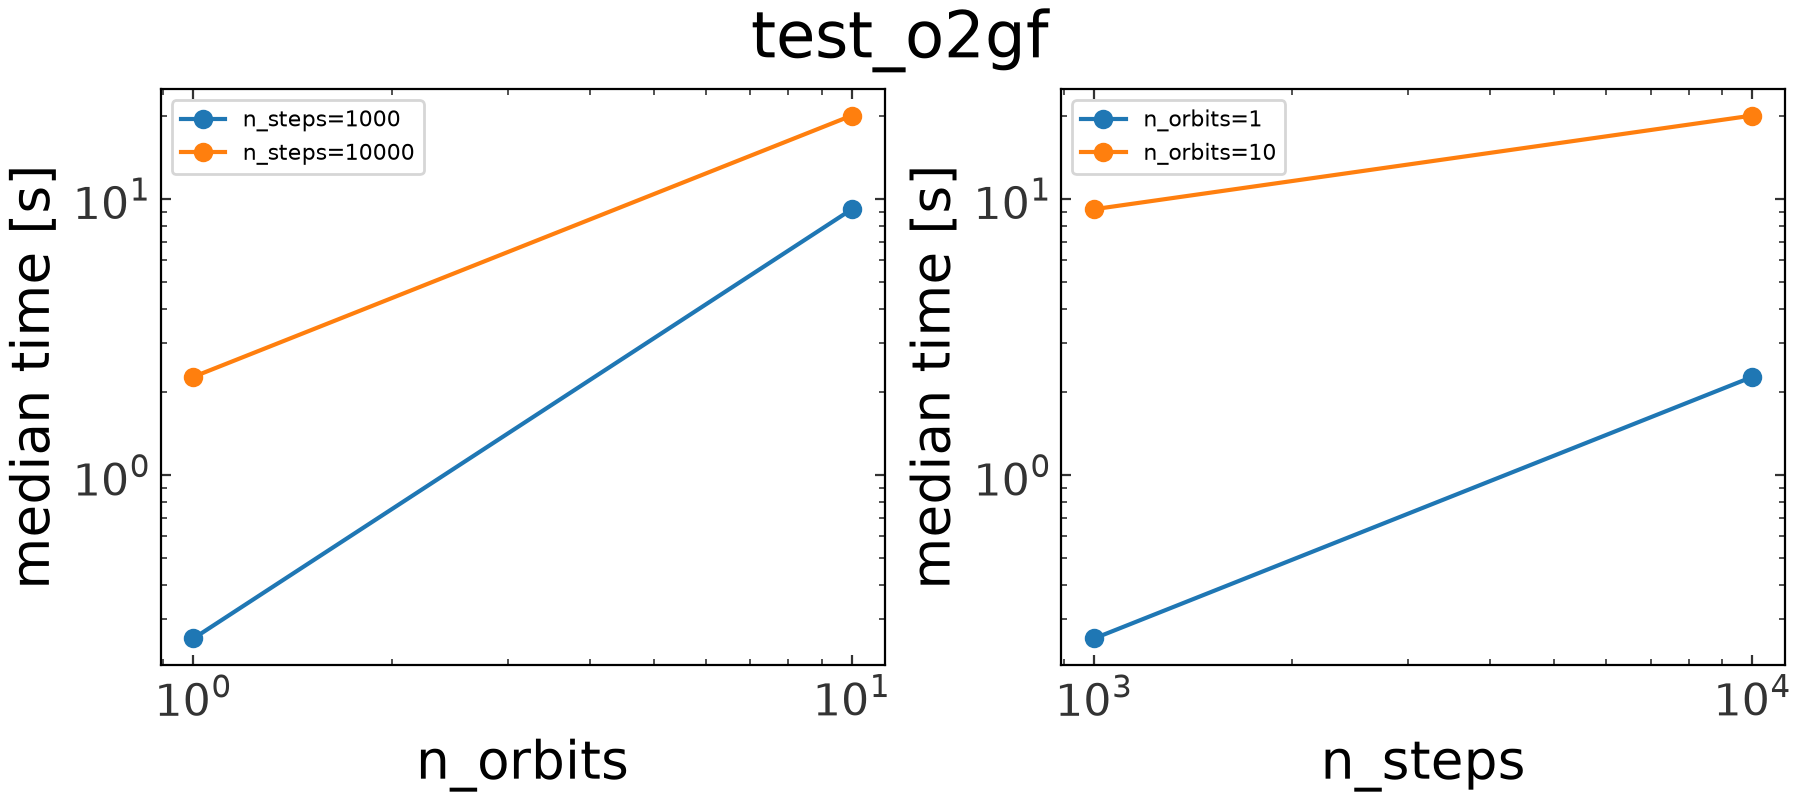
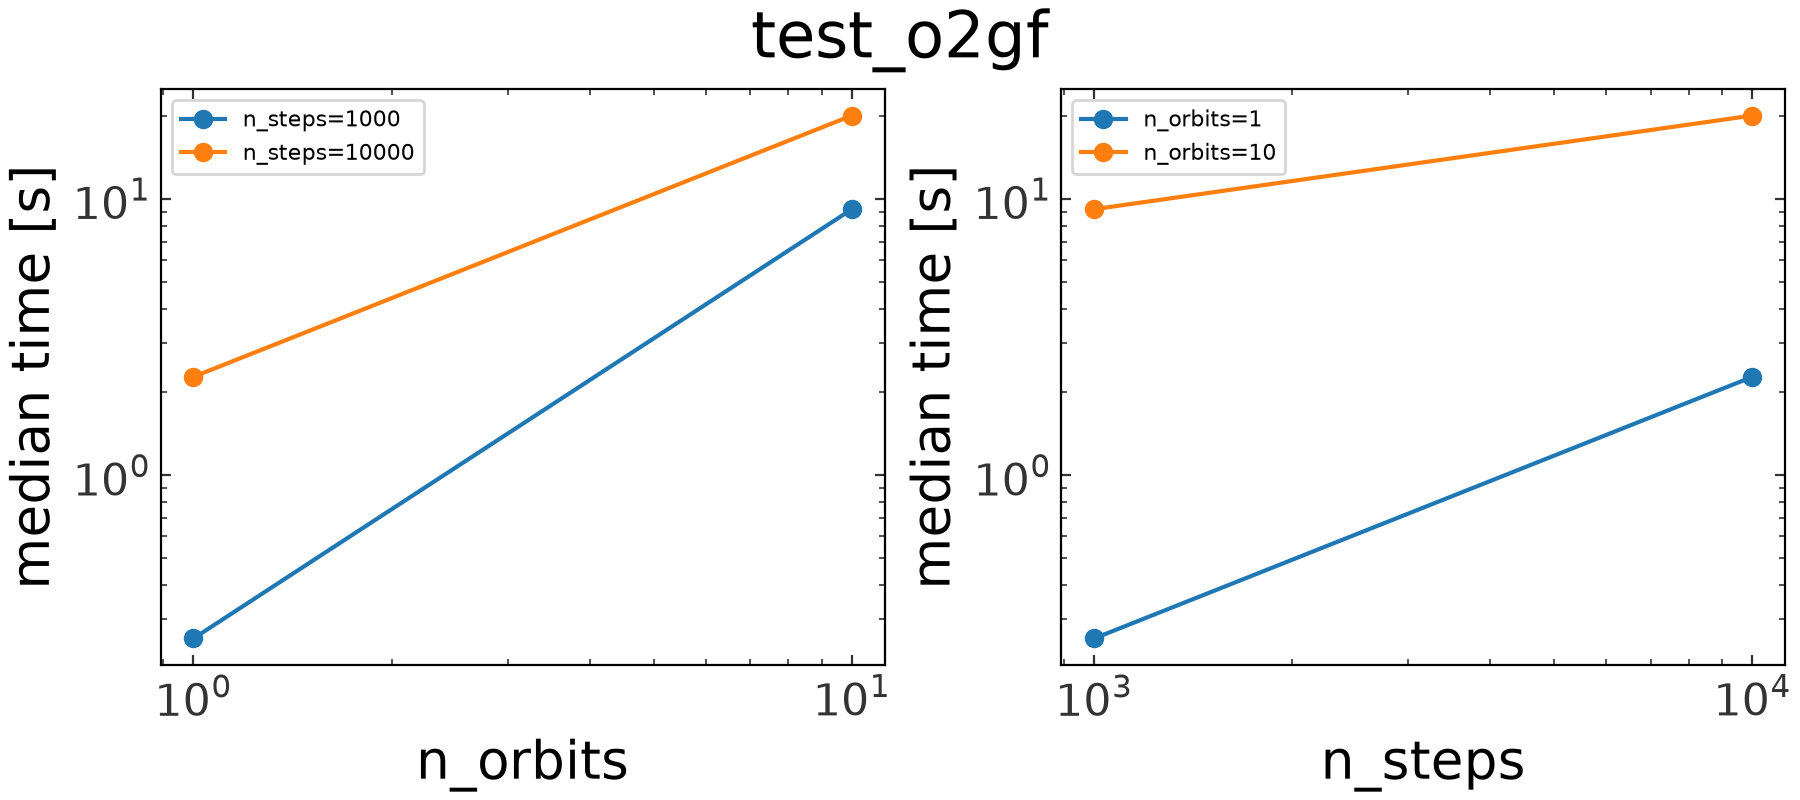
for a set of phase-space positions, and test_o2gf times
find_actions_o2gf() for a set of orbits (orbit
integration is not included in the timing).